Plot Features Over Fields
Collapse Tensorflow Coupon Figure
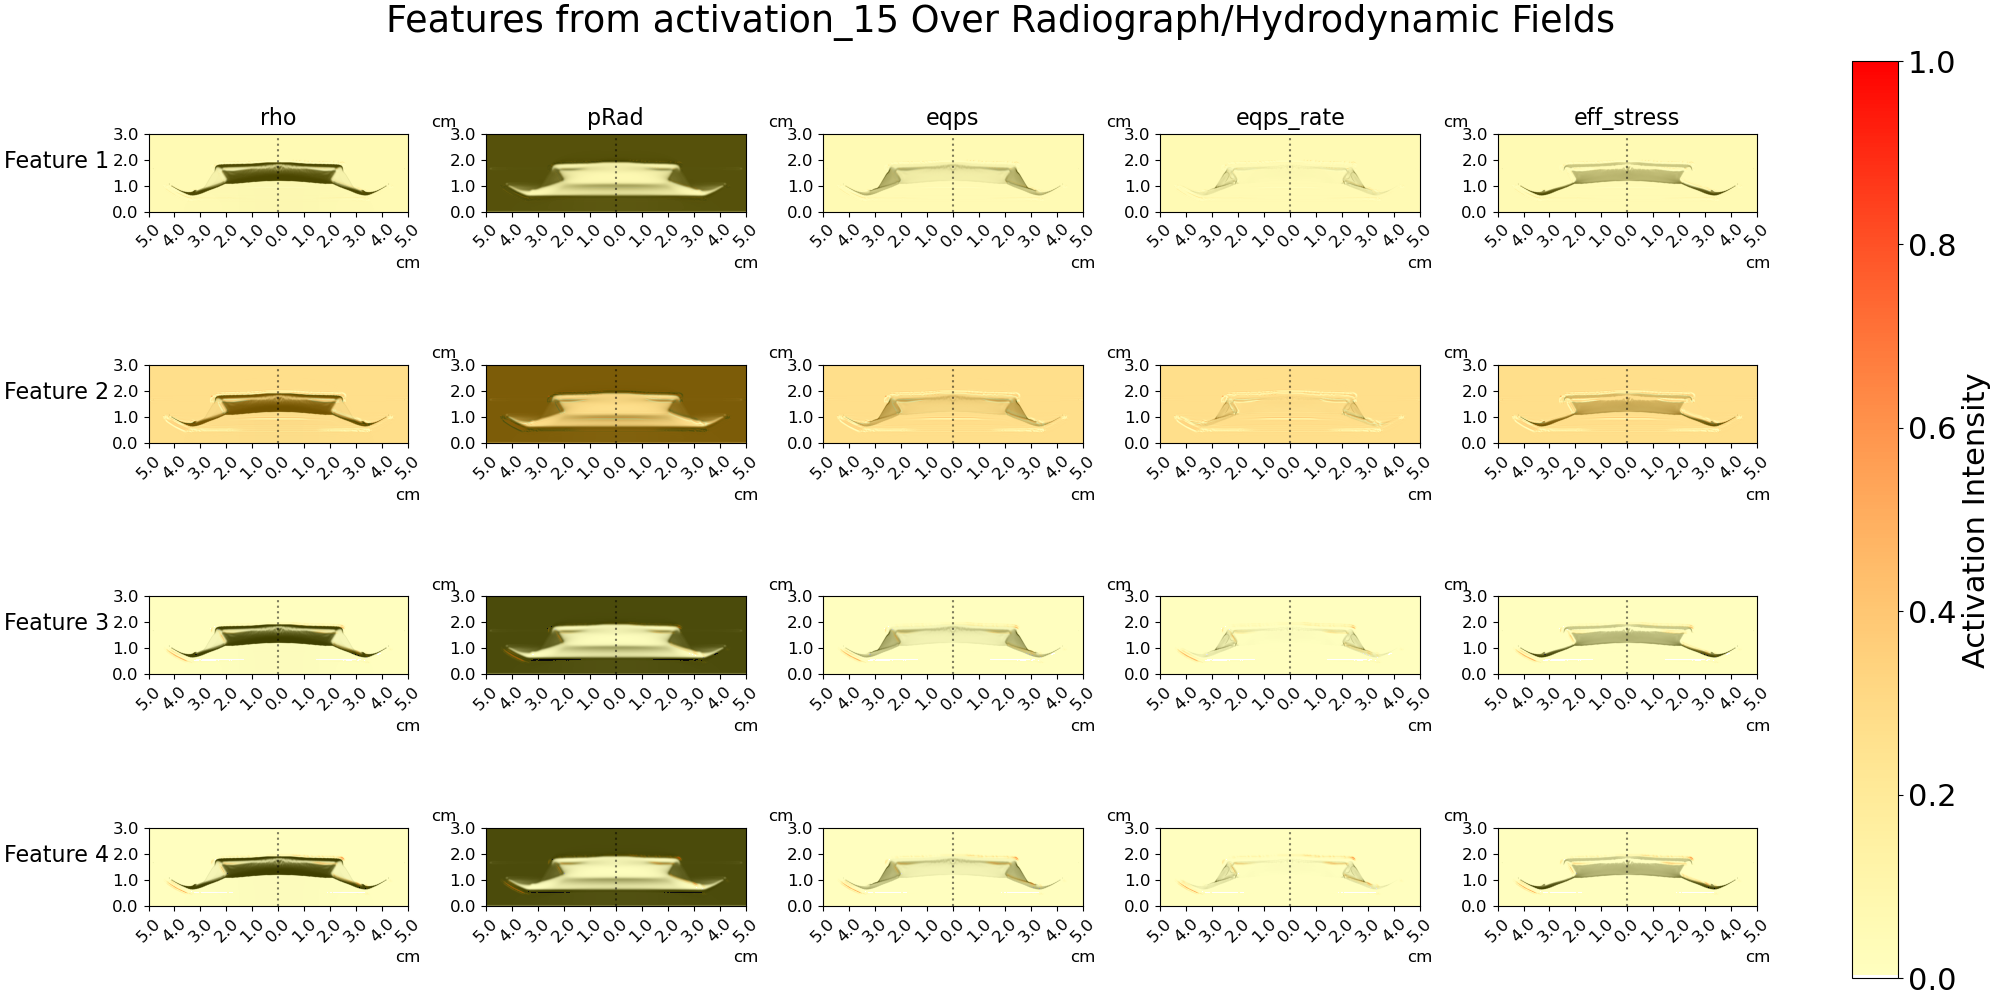
Features Extracted from the Tensorflow Coupon Network Plotted Over Fields
Collapse Pytorch Nested Cylinder Figure
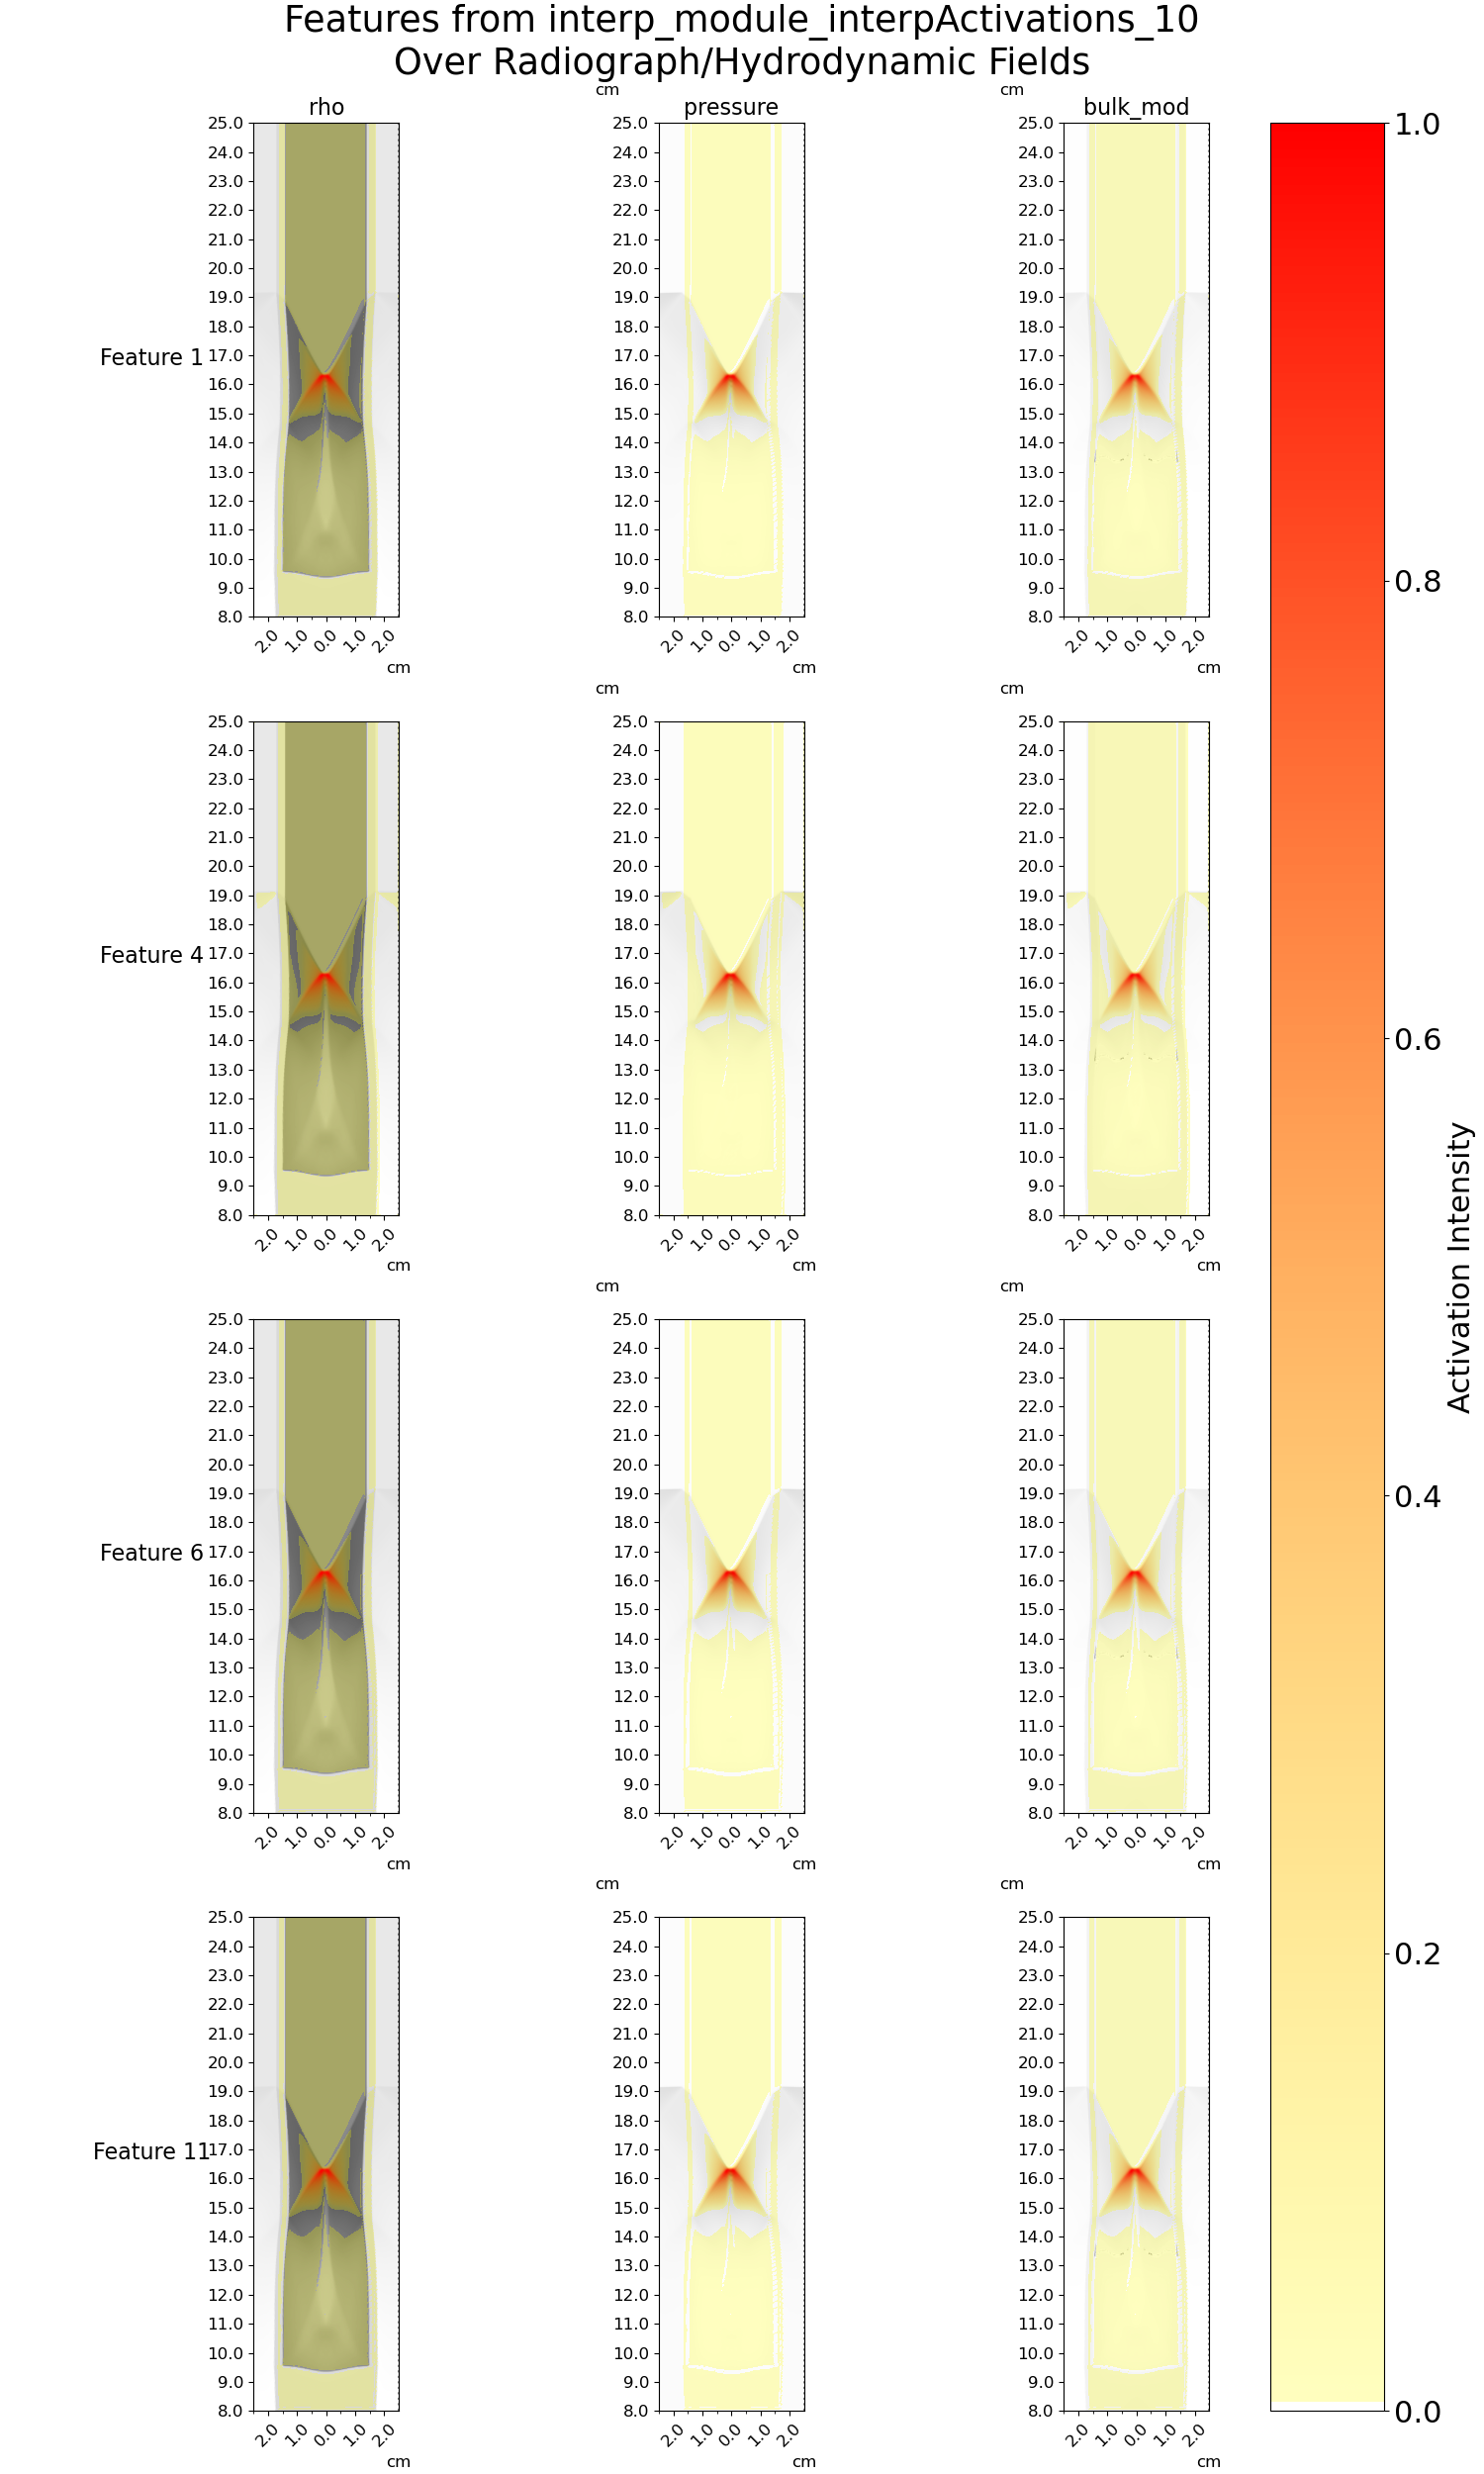
Features Extracted from the Pytorch Nested Cylinder Network Plotted Over Fields
Code Documentation
- Plots a grid of features over hydrodynamic/radiographic fields
Can plot all features (
-T All) or some selected features (-T # #)Can plot all fields (
-F All) or some selected features (-F str str)
Input Line for TF Coupon Models:
python feature_over_field.py -P tensorflow -E coupon -M ../examples/tf_coupon/trained_pRad2TePla_model.h5 -IF pRad -IN ../examples/tf_coupon/data/r60um_tpl112_complete_idx00110.npz -DF ../examples/tf_coupon/coupon_design_file.csv -L activation_15 -T 1 2 3 4 -NM ft01 -F rho pRad eqps eqps_rate eff_stress -S ../examples/tf_coupon/figures/
Input Line for PYT Nested Cylinder Models:
python feature_over_field.py -P pytorch -E nestedcylinder -M ../examples/pyt_nestedcyl/trained_rho2PTW_model.pth -IF rho -IN ../examples/pyt_nestedcyl/data/nc231213_Sn_id0643_pvi_idx00112.npz -DF ../examples/pyt_nestedcyl/nestedcyl_design_file.csv -L interp_module.interpActivations.10 -T 1 4 6 11 -F rho pressure bulk_mod -S ../examples/pyt_nestedcyl/figures/
Arguments
Plots a grid of selected features over selected fields
usage: python feature_over_field.py [-h] [--PACKAGE] [--EXPERIMENT] [--MODEL]
                                    [--INPUT_FIELD] [--INPUT_NPZ]
                                    [--DESIGN_FILE] [--PRINT_LAYERS]
                                    [--PRINT_FEATURES] [--PRINT_FIELDS]
                                    [--LAYER] [--FEATURES  [...]] [--MAT_NORM]
                                    [--FIELDS  [...]] [--ALPHA1] [--ALPHA2]
                                    [--COLOR1] [--COLOR2] [--SAVE_FIG]
Named Arguments
- --PACKAGE, -P
Possible choices: tensorflow, pytorch
Which python package was used to create the model
Default: “tensorflow”
- --EXPERIMENT, -E
Possible choices: coupon, nestedcylinder
Which experiment the model was trained on
Default: “coupon”
- --MODEL, -M
Model file
Default: “../examples/tf_coupon/trained_pRad2TePla_model.h5”
- --INPUT_FIELD, -IF
The radiographic/hydrodynamic field the model is trained on
Default: “pRad”
- --INPUT_NPZ, -IN
The .npz file with an input image to the model
Default: “../examples/tf_coupon/data/r60um_tpl112_complete_idx00110.npz”
- --DESIGN_FILE, -DF
The .csv file with master design study parameters
Default: “../examples/tf_coupon/coupon_design_file.csv”
- --PRINT_LAYERS, -PL
Prints list of layer names in a model (passed with -M) and quits program
Default: False
- --PRINT_FEATURES, -PT
Prints number of features extracted by a layer (passed with -L) and quits program
Default: False
- --PRINT_FIELDS, -PF
Prints list of hydrodynamic/radiographic fields present in a given .npz file (passed with -IN) and quits program
Default: False
- --LAYER, -L
Name of model layer that features will be extracted from
Default: “None”
- --FEATURES, -T
List of features to include; “Grid” plots all features in one figure using subplots; “All” plots all features each in a new figure; A list of integers can be passed to plot those features each in a new figure. Integer convention starts at 1.
Default: [‘All’]
- --MAT_NORM, -NM
Possible choices: ft01, all01, none
How the extracted features will be normalized, resulting in a scaled matrix; “ft01” normalizes by the min and max of each feature separately; “all01” normalizes by the min and max of all extracted features; “none” does not normalize features.
Default: “ft01”
- --FIELDS, -F
List of fields to be included; pass “none” to use an all-zero field; pass “All” to use all valid fields.
Default: [‘rho’, ‘eqps’, ‘eqps_rate’, ‘eff_stress’, ‘porosity’]
- --ALPHA1, -A1
Opacity of colormap at value 0
Default: 0.25
- --ALPHA2, -A2
Opacity of colormap at value 1
Default: 1.0
- --COLOR1, -C1
Possible choices: aliceblue, antiquewhite, aqua, aquamarine, azure, beige, bisque, black, blanchedalmond, blue, blueviolet, brown, burlywood, cadetblue, chartreuse, chocolate, coral, cornflowerblue, cornsilk, crimson, cyan, darkblue, darkcyan, darkgoldenrod, darkgray, darkgreen, darkgrey, darkkhaki, darkmagenta, darkolivegreen, darkorange, darkorchid, darkred, darksalmon, darkseagreen, darkslateblue, darkslategray, darkslategrey, darkturquoise, darkviolet, deeppink, deepskyblue, dimgray, dimgrey, dodgerblue, firebrick, floralwhite, forestgreen, fuchsia, gainsboro, ghostwhite, gold, goldenrod, gray, green, greenyellow, grey, honeydew, hotpink, indianred, indigo, ivory, khaki, lavender, lavenderblush, lawngreen, lemonchiffon, lightblue, lightcoral, lightcyan, lightgoldenrodyellow, lightgray, lightgreen, lightgrey, lightpink, lightsalmon, lightseagreen, lightskyblue, lightslategray, lightslategrey, lightsteelblue, lightyellow, lime, limegreen, linen, magenta, maroon, mediumaquamarine, mediumblue, mediumorchid, mediumpurple, mediumseagreen, mediumslateblue, mediumspringgreen, mediumturquoise, mediumvioletred, midnightblue, mintcream, mistyrose, moccasin, navajowhite, navy, oldlace, olive, olivedrab, orange, orangered, orchid, palegoldenrod, palegreen, paleturquoise, palevioletred, papayawhip, peachpuff, peru, pink, plum, powderblue, purple, rebeccapurple, red, rosybrown, royalblue, saddlebrown, salmon, sandybrown, seagreen, seashell, sienna, silver, skyblue, slateblue, slategray, slategrey, snow, springgreen, steelblue, tan, teal, thistle, tomato, turquoise, violet, wheat, white, whitesmoke, yellow, yellowgreen
Color of colormap at value 0; Choose from matplotlib CSS4 color list.
Default: “yellow”
- --COLOR2, -C2
Possible choices: aliceblue, antiquewhite, aqua, aquamarine, azure, beige, bisque, black, blanchedalmond, blue, blueviolet, brown, burlywood, cadetblue, chartreuse, chocolate, coral, cornflowerblue, cornsilk, crimson, cyan, darkblue, darkcyan, darkgoldenrod, darkgray, darkgreen, darkgrey, darkkhaki, darkmagenta, darkolivegreen, darkorange, darkorchid, darkred, darksalmon, darkseagreen, darkslateblue, darkslategray, darkslategrey, darkturquoise, darkviolet, deeppink, deepskyblue, dimgray, dimgrey, dodgerblue, firebrick, floralwhite, forestgreen, fuchsia, gainsboro, ghostwhite, gold, goldenrod, gray, green, greenyellow, grey, honeydew, hotpink, indianred, indigo, ivory, khaki, lavender, lavenderblush, lawngreen, lemonchiffon, lightblue, lightcoral, lightcyan, lightgoldenrodyellow, lightgray, lightgreen, lightgrey, lightpink, lightsalmon, lightseagreen, lightskyblue, lightslategray, lightslategrey, lightsteelblue, lightyellow, lime, limegreen, linen, magenta, maroon, mediumaquamarine, mediumblue, mediumorchid, mediumpurple, mediumseagreen, mediumslateblue, mediumspringgreen, mediumturquoise, mediumvioletred, midnightblue, mintcream, mistyrose, moccasin, navajowhite, navy, oldlace, olive, olivedrab, orange, orangered, orchid, palegoldenrod, palegreen, paleturquoise, palevioletred, papayawhip, peachpuff, peru, pink, plum, powderblue, purple, rebeccapurple, red, rosybrown, royalblue, saddlebrown, salmon, sandybrown, seagreen, seashell, sienna, silver, skyblue, slateblue, slategray, slategrey, snow, springgreen, steelblue, tan, teal, thistle, tomato, turquoise, violet, wheat, white, whitesmoke, yellow, yellowgreen
Color of colormap at value 1; Choose from matplotlib CSS4 color list.
Default: “red”
- --SAVE_FIG, -S
Directory to save the outputs to.
Default: “../examples/tf_coupon/figures/”